Historian Charts
Use the EasyChart™ component in the Designer to display historical data or realtime data depending on the range of your time selection. Simply drag-and-drop history-enabled tags onto a chart to create chart pens and data trends.
Let's look at trending tags and displaying the information in a graph. In both of the following examples, data was logged first.
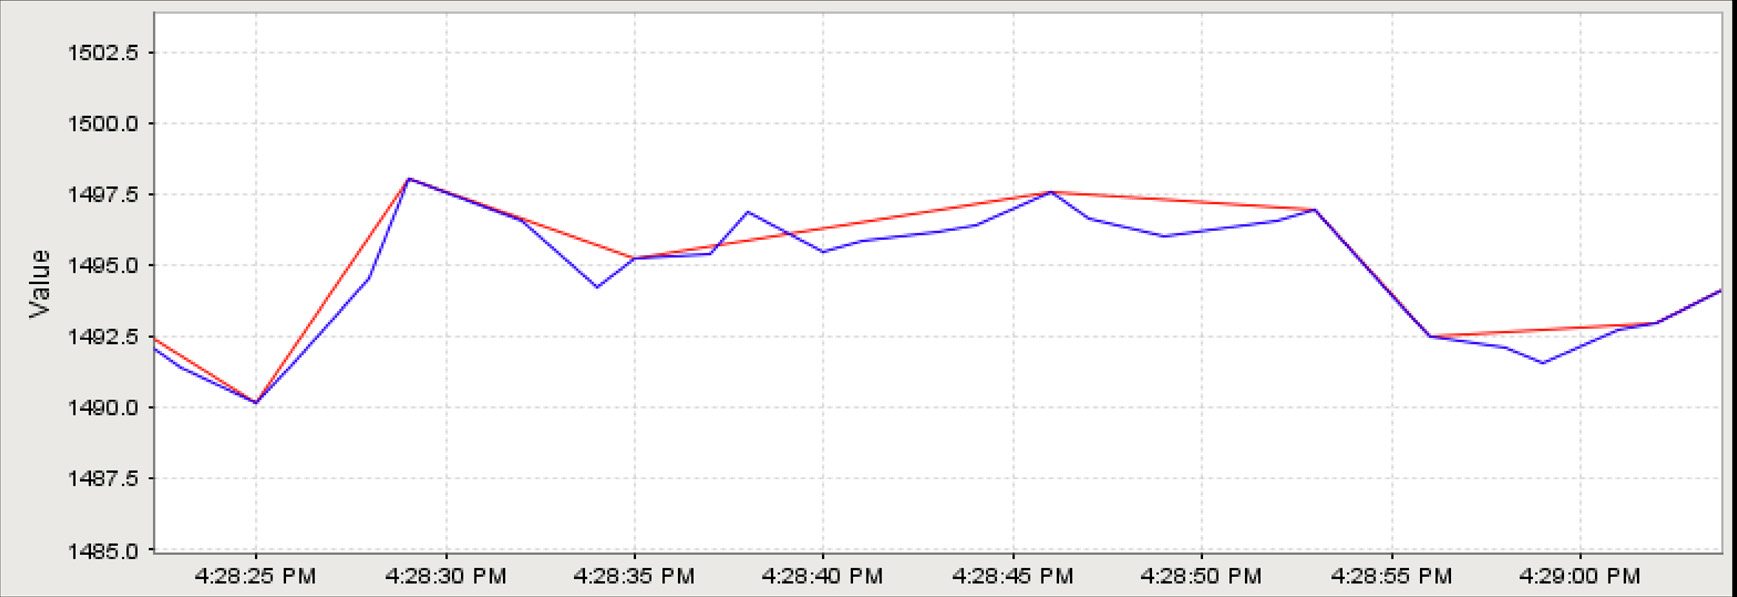
Example 1
Here is an EasyChart example of raw ( blue ) vs. compressed ( red ) data using the analog mode:
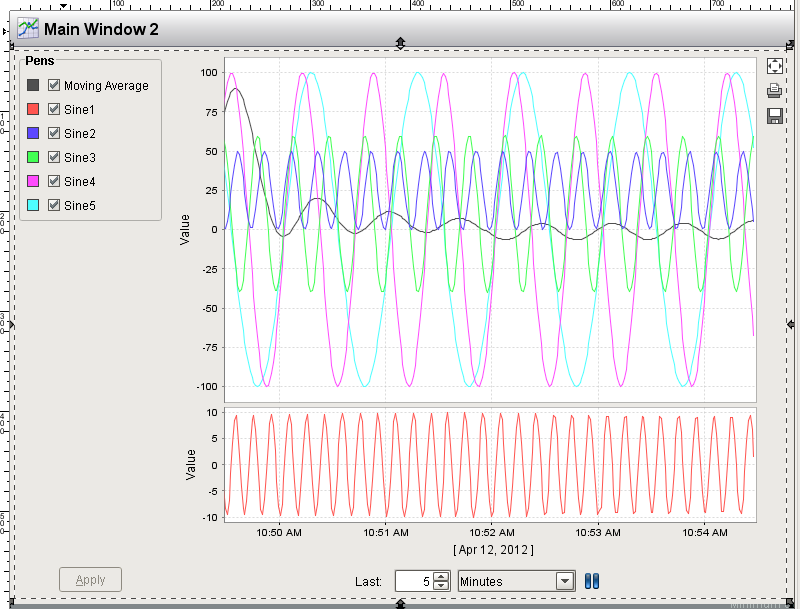
Example 2
Here is another example:
In this section ...