Using Designer User Interface
Designer's Workspace
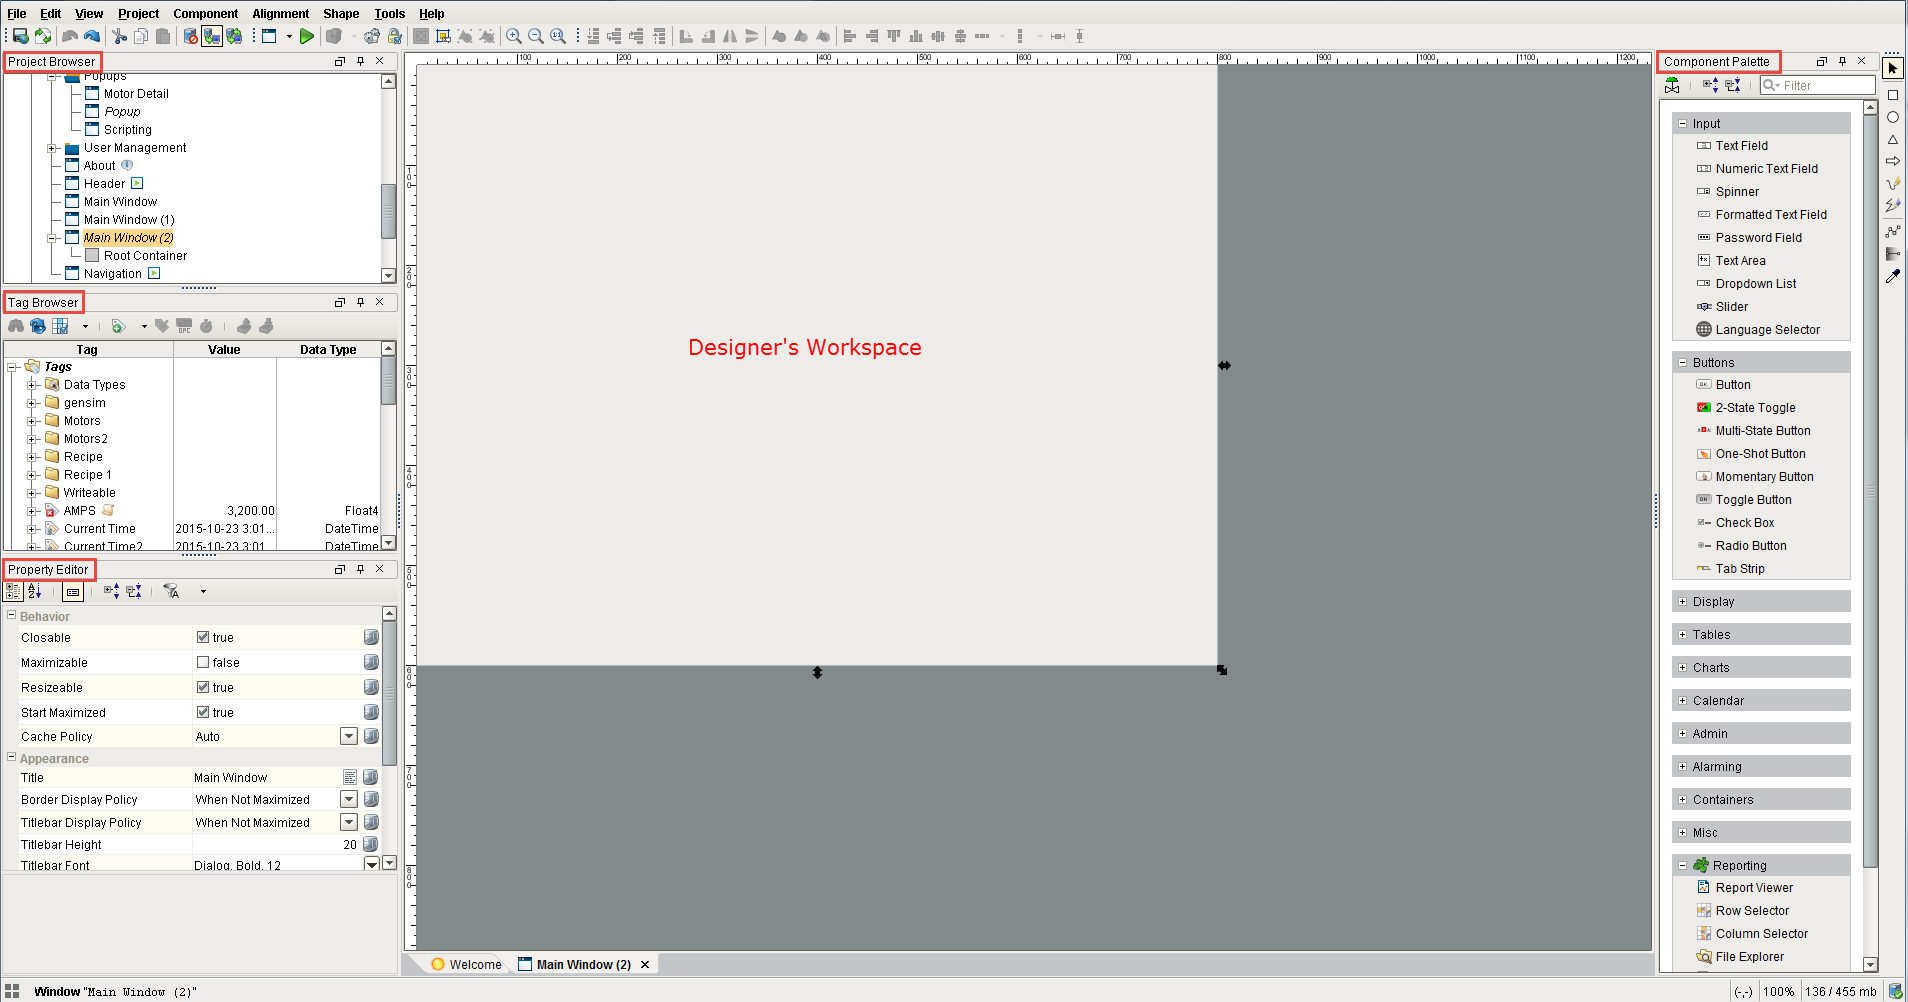
The Designer is organized in panels around a central workspace. Some of these panels include: Project Browser, Tag Browser, and Property Editor. The workspace changes depending on the type of resource that you are currently editing. For example, if you are editing a Window, your workspace will be the Window Designer. If you are editing a Transaction Group, your workspace will be the Transaction Group Editor, and so on.
There are many dockable and dragable panels that surround the workspace, as well as the familiar menu bars and toolbars. The dockable panels can be rearranged as you wish. Each type of workspace can have panels that are only valid when that workspace is active. Each workspace remembers its own perspective, which is the docking arrangement of the panels around it.
If you have closed a panel and want to get it back, re-enable it from the View > Panels submenu. The View > Reset Panels will reset the user interface back to its default window arrangement.
Tools Menu
The Tools menu in the Designer provides some tools to help you when creating projects. The Console, Image Management, and Symbol Factory tools are described here.
Tools > Console
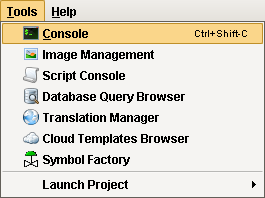
The Output Console is the script-writers best friend. It is a dockable panel, and you can open it via the Tools > Console menu or the Ctrl-Shift-C keyboard shortcut. The output console is most frequently used to test and debug Python scripts in Ignition.
For example, by using the print function in your script, you can observe the inner workings of your script as it executes. If you executed the following script:
# A python script that demonstrates the print statement print "Print me first"x=10z=2print x, y, x/y #Result looks like this:#Print me first#10 2 5
Note: The output console is also available in the Vision Client from Help > Diagnostics .
See also: Scripting in Ignition , Help Menu
Tools > Image Management
The Image Manager is available from the Tools > Image Management menu. This tool is a drag-and-drop browser that helps manage the images that are stored on the Gateway. It is important to realize that these images are shared across all projects: they are not stored inside a project itself. Use the toolbar at the top to do common tasks like uploading new images and creating folders. You can drag images and folders from your computer's desktop or hard drive into this window to easily upload new images to the Gateway.
You can also get to this tool by putting an Component Palette > Display > Image component on a window, and clicking the browse button on the image's Image Path property.
See also: Images (png, jpg, gif)
Tools > Symbol Factory
If you have the Symbol Factory module installed, you'll be able to open the Symbol Factory browser under the Tools menu in the Designer. You can browse through the symbols or use the convenient search function to find the symbol you need.
Once you find a symbol, you can drag-and-drop it into a window. Each symbol is dropped as a shape group. You will be able to un-group it or double-click into the group just as if you had drawn the symbol yourself using fundamental shapes. This means that you can alter the shape if you need to, or bind any colors inside the shape to a tag to make the shape dynamic.
Help Menu
Help > Diagnostics

The Help menu in the Designer and the Vision Client has a Diagnostics window that contains a number of tabs each providing a useful troubleshooting feature. You can right-click on any of the tabs to show or hide the other tabs. These tabs or the troubleshooting features are as follows:
Performance Tab
Displays a number of small realtime charts that show various aspects of the currently executing Designer or Client's performance. These charts can be very useful to help troubleshoot performance issues, especially slow queries. One of the most common causes of query slowdown is simply running too many queries too frequently, and the # of Select Queries (Queries/Second) chart can help identify when this is occurring.
The statistics shown on this page apply to the current session only, you can see the Gateway statistics from the Status section of the Gateway.
Console Tab
Displays the Ignition Output Console.
Log Viewer
Displays the logged events for the current Designer or Client session. Whenever errors occur, they are logged and displayed in this tab. This is a good place to go when troubleshooting an issue, as any errors shown here may illuminate the cause of the problem. To view entries across all categories chronologically, uncheck the Group Categories checkbox.
Logging Levels
Determines the verbosity of a host of internal loggers. Most users will not use this tab unless prompted by a technical support representative.
Thread Viewer
Shows information about the currently running threads. Most users will not use this tab unless prompted by a technical support representative.
Connections
Displays the Gateway connection status as being connected or not.
Docking System
The Designer's docking system provides a very flexible user interface, allowing you to customize the layout as you wish. To re-arrange the dockable panels, simply drag on their title bars. As you are dragging the panel, use the highlighted border that appears to gauge where the panel will be moved to. Dockable panels can be in one of four modes:
-
Docked - The panel is visible, and located somewhere around the perimeter of the workspace. If two panels are docked in the same location, a tab strip will appear to switch between the two panels.
-
Floating - A panel can be dragged outside of the workspace perimeter to be floated. The panel can now be positioned anywhere on your desktop.
-
Pinned - Pinning a panel makes it minimize to one of the four sides of the Designer, represented by a small tab. Hover over the tab to use the panel.
-
Hidden - A hidden panel is not shown. You can open it again by selecting it in the View > Panels menu.
Toolbars can also be rearranged and floated to your liking. Simply drag on the "textured" left edge of the toolbar. If you have re-arranged your panels into a layout that you don't like, you can quickly revert back to the default by selecting the View > Reset Panels option from the menu bar.
Expert Tip
Your docking preferences are stored under %USER_HOME%/.ignition/*.layout. If you really want to reset your preferences, remove these files and restart the Designer.